Dataset Information
| Overview | |
|---|---|
| Title | A single-cell atlas of the human cortex reveals drivers of transcriptional changes in Alzheimer’s disease in specific cell subpopulations (human) |
| Sub dataset | N/A |
| Design | Single Nuclei RNA sequencing of 8 10x libraries with each library containing 2 individuals (n =16) |
| Abstract | There is currently little information about how individual cell types contribute to Alzheimer’s disease (AD). Here, we applied single-nucleus RNA-seq (snRNA-seq) on the entorhinal cortex from control and AD brains of twelve individuals, yielding a total of 13,214 high quality nuclei. We detail cell-type-specific gene expression patterns, unveiling how transcriptional changes in specific cell subpopulations contribute to AD. We report that the AD risk gene, APOE, is specifically repressed in AD oligodendrocyte progenitor cells and astrocyte subpopulations, and upregulated in an AD-specific microglial subopulation. Integrating transcription factor regulatory modules with AD risk loci revealed drivers of cell-type-specific fate transitions towards AD. For example, transcription factor EB, a master regulator of lysosomal function, regulates multiple disease genes in a specific AD astrocyte sub-population. These results provide insights into the coordinated control of AD risk genes and their cell-type specific contribution to disease susceptibility and are available at http://adsn.ddnetbio.com. |
| Year | 2019 |
| Reference | A single-cell atlas of entorhinal cortex from individuals with Alzheimer's disease reveals cell-type-specific gene expression regulation. Nat Neurosci. 2019;22(12):2087-2097. |
| PubMed | 31768052 |
| Source |
Expression data source: GSE138852 Metadata source: Supplementary table 1 |
| Sample description | |
| Organism | Homo sapiens |
| Type | snRNA-seq |
| Samples | |
| Count | |
| Cell types | |
| Metadata availability | |
Sample Metadata
Dimensional Reduction Plot Colored by [ Cell Type ]
Dimensional Reduction Plot Colored by Expression of [ ]
Dimensional Reduction Plot Colored by Sample Metadata [ ]
COLOR BY
SAMPLE SELECTOR
PLOT CONTROL
OVERVIEW

Differential Expression Analysis
Select StrategyComparisonCell type to show comparison results.
Select Cutoff to check for result availabilities of PPI network, Enrichment Analysis, and Drug Screen.
log2FC = FDR =
| Number of DEGs by cutoffs | |log2FC| > | |||
|---|---|---|---|---|
| 0.25 | 0.1 | 0 | ||
| 0.05 | ||||
| FDR < | 0.10 | |||
| 0.20 | ||||
| Gene (log2FC ≥ 0) | log2FC | FDR |
|---|---|---|
| SELECT A COMPARISON TO VIEW THE UP-EXPRESSED GENES | ||
| Gene (log2FC < 0) | log2FC | FDR |
|---|---|---|
| SELECT A COMPARISON TO VIEW THE DOWN-EXPRESSED GENES | ||
Enrichment Analysis
| KEGG Pathways Human | Overlap | P | FDR |
|---|---|---|---|
| Gene Ontology - Biological Process | Overlap | P | FDR |
|---|---|---|---|
Drug Screening
| Significantly inversely related | ES | FDR |
|---|---|---|
| Significantly positively related | ES | FDR |
|---|---|---|
| Signature ID | |
|
|---|---|---|
| Perturbagen ID | ||
| Name | ||
| SMILES | ||
| INCHI KEY | ||
| DrugBank ID | ||
| Cell line | ||
| Dose | ||
| Time | ||
| # Replicates | ||
| QC Pass | ||
| High Quality | ||
| Tool |
Cell-cell Interaction Analysis
Click a cell-cell interaction from the heatmap to view the over-represented ligand-receptor pairs.
Significant LRIs in +
| Ligand | Receptor | Mean | P |
|---|---|---|---|
| SELECT A CELL-CELL INTERACTION FROM THE HEATMAP TO VIEW THE OVER-REPRESENTED LIGAND-RECEPTOR PAIRS | |||
All LRIs in descending order by # of significant means
| Ligand | Receptor | # CCI | CCI net |
|---|---|---|---|
| SELECT AN ANALYSIS TO VIEW ALL THE OVER-REPRESENTED LIGAND-RECEPTOR PAIRS | |||
Protein-Protein Interaction Network for DEGs in the Selected DE Comparison Drug-Target Network for Selected Drug Perturbation Network for Selected Compound Ligand-Receptor Interaction Network for Selected Cell-Cell Interaction Cell-Cell Interaction Network for Selected Ligand-Receptor Interaction
PLOT CONTROL
LEGEND
Sorry, we cannot retrieve data from the server at this time. Please refresh the page later. If the issue persists, please contact us.
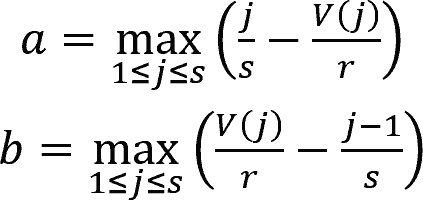 where j = 1, 2, ..., s were the indexes of DEGs sorted by their ranks in the gene profiles of the perturbation in ascending order.
The rank of gene j is denoted by V(j), where 1 ≤ V(j) ≤ r, with r being the total number of genes in the profile.
Then, ESup/down was set to aup/down if aup/down > bup/down, and was set to -bup/down if bup/down > aup/down.
Permutation tests repeated 10000 times using randomly generated gene lists with the same n(up) and n(down) as the DEGs were performed to measure the one-tailed p values of the ES scores.
Depending on the sign of the ES, the one-tailed p value measures either the left-tail (ES < 0) or the right-tail (ES > 0). P values were FDR adjusted and FDR < 0.05 were considered significant.
where j = 1, 2, ..., s were the indexes of DEGs sorted by their ranks in the gene profiles of the perturbation in ascending order.
The rank of gene j is denoted by V(j), where 1 ≤ V(j) ≤ r, with r being the total number of genes in the profile.
Then, ESup/down was set to aup/down if aup/down > bup/down, and was set to -bup/down if bup/down > aup/down.
Permutation tests repeated 10000 times using randomly generated gene lists with the same n(up) and n(down) as the DEGs were performed to measure the one-tailed p values of the ES scores.
Depending on the sign of the ES, the one-tailed p value measures either the left-tail (ES < 0) or the right-tail (ES > 0). P values were FDR adjusted and FDR < 0.05 were considered significant.